For this portion of the exam you will NOT have access to a computer. You may not use Microsoft Excel or a calculator on this portion of the exam. Once you turn in this portion of the Exam you may start on the Hands-On portion. This portion should take you 15-20 minutes.
1. Describe the difference between $A$1, $A1, A$1, and A1. Explain why this difference is important as you drag formulas around the worksheet.
2. If you want to display a floating point number as a whole number (0 digits after the decimal point) you could format the cell or use the INT() function. How do these two methods differ? How will each method affect a cell that references that cell?
3. List the Excel comparison operators and what they mean.
4. What is the solution to: =MOD(4,3)
5. What is the solution to: =4+2/4-1. Write your answer with two places after the decimal point. You will receive zero credit for answers containing a fraction.
6. When using the PMT() function to determine the value of the monthly payments to pay off a loan, why do you need to specify the rate as 6%/12 if the loan charges you 6% yearly interest? For example: =PMT(6%/12, 12*5, 5000) will calculate the monthly payments to pay off a 5 year loan of $5000 with a 6% yearly interest rate.
7. How would the arguments to PMT() change if, in the above example, payments were made quarterly (every 3 months)?
8. Why is the value returned by the above PMT() example negative?
For this portion of the exam you will have access to Microsoft Excel and its help facilities. You will not be able to use your nodes, the Internet, or a calculator. Each problem is to be solved in is own worksheet, with all problems being solved in the same Excel file. This file will need to be submitted to the CS130 Drop folder NO LATER THAN 7:15pm.
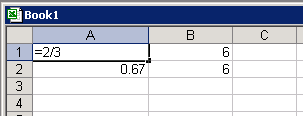
Build the worksheet shown below. Cell A1 contains the formula =2/3, cell B1 contains the value 6, cell A2 contains the value 0.67, cell B2 contains the value 6. Only cell A1 contains a forumla. Format cell A1 to show two digits beyond the decimal point.
What value appears in A1? Why?
In cell C1, write a formula that will multiply the value in cell A1 and the value in cell B1. Write a similar formula in C2 that references A2 and B2. Format cells C1 and C2 to show two digits beyond the decimal point. What values appear in C1 and C2? Are they the same? Why or why not?
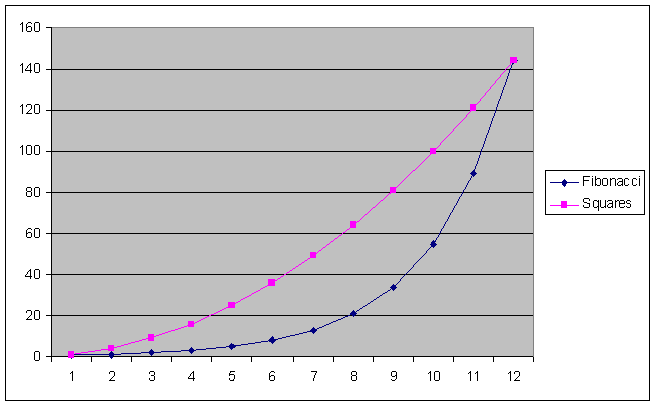
The first few fibonacci numbers are: 1,1,2,3,5,8,... where the first two numbers are always 1,1 and each subsequent number is found by adding the previous two numbers. In one column, I would like you to find the first 12 fibonacci numbers.
In another column, I would like you to find the first 12 solutions to the equation: y=x^2 over the interval 1<=x<=12 where x is an integer. Once you have these two columns laid out, show the graph of each set of numbers with the data properly labeled and a chart title.
Challenge (Hard): You can only use two columns of data to solve Problem 1. Hints: in row 3 you should calculate x^3; you may need to use a function.
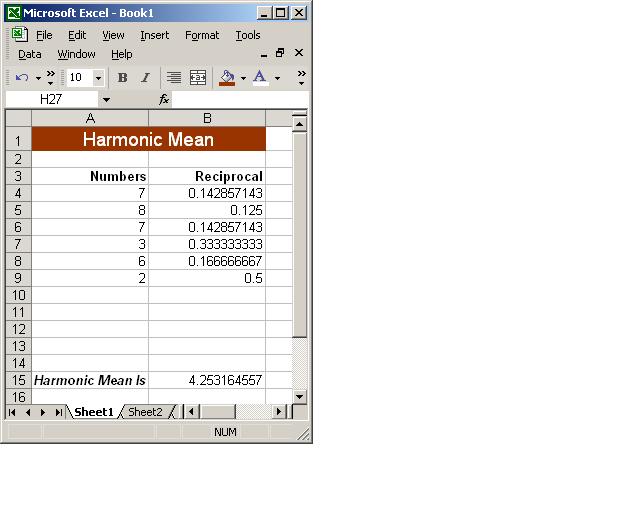
The harmonic mean of a set of numbers is the number of values N, divided by the reciprocals of each number. As an example, the harmonic mean of 7,8,7,3,6,2 is:
6 / (1/7 + 1/8 + 1/7 + 1/3 + 1/6 + 1/2) = 4.3
Design an Excel worksheet that allows the user the ability to enter up to 10 numbers and prints the harmonic mean of the numbers entered. Note: The user can enter from 1 and 10 different numbers inclusively.
Here is an example:
Harmonic Mean = 4.253165
| Numbers | Reciprocal |
| 7 | 0.142857143 |
| 8 | 0.125 |
| 7 | 0.142857143 |
| 3 | 0.333333333 |
| 6 | 0.166666667 |
| 2 | 0.5 |
Make your worksheet look like the following:
For a random number of selected homes sold in Washington County, the annual tax amount (in thousands of dollars) and selling price (in thousands of dollars) are as follows:
Taxes:           4.0  2.4  1.8  1.5  1.4  1.4  3.0  1.9
Selling  Price:  265  142  114  160  130  150  228  145
a) Enter the above information into an Excel worksheet.
b) Perform a Linear Regression on the data with your graph properly labeled and displaying the linear equation and R^2 value.
c) For an annual tax amount of $2,450, what might we expect the selling price of this house to be?
d) For a selling price of $235,000, what might we expect the taxes to be for this house?
e) Is this linear regression a good approximation of the data?
Build a worksheet that will determine how much your monthly payment will be on a loan for a house. The loan amount is $150,000, the yearly interest rate is 7%, and it is a 30 year loan. Answer the following questions:
Make sure the total interest paid is updated when you set your monthly payment to $800 and $1500 dollars. Be sure to format all dollar amounts correctly.