SPSS & Regression
One Variable of Interest
Another type of graph is a Bar Chart (Cell Plot). Bar Charts are use to show the means for a variable of your choice split by some nominal variable.
7.1 Exercise
There is an Excel file called "Lipid Data" in the CS130 Public folder. I would like you to take this file, open it in SPSS, and produce a Bar Chart showing the mean weight of the people in the file split by Gender. Also make a plot of the mean Cholesterol split by Gender. These two plots really allow us to examine one variable of interest.

More than One Variable of Interest
What if we want to examine the relationship between two variables.?
In statistics, we can define two types of variables:
- Independent - "it is what it is" and nothing influences it (e.g. Gender)
- Dependent - most likely dependent on another variable (e.g. Cholesterol may be dependent on age)
7.2 Exercise
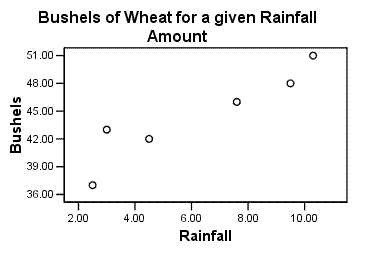
Consider the following table which shows the number of bushels of wheat produced for the given rainfall amounts:
Rainfall 2.5 3 4.5 7.6 9.5 10.3 in inches
Bushels 37 43 42 46 48 51 of wheat
- Create a scatterplot (scattergram) for this data. You need to correctly set up the data in SPSS and then graph the data correctly by deciding which variable is the dependent variable and which is the independent variable.
What is the dependent variabel? _________________________
What is the independent variable? ________________________

- Least Squares Regression is a technique used to find from the data, the equation of the best line that fits through the scattergram. In essence, we want to find a line of the form y = mx + b for the given data. We have used the various regression analysis tools from Excel. Enter the above data into Excel and perform a linear regression. Write down the equation and regression coefficient here.
Linear Equation: ________________________________
Regression Coefficient: ___________________________
- Let's now try and use regression in SPSS. Find a linear regression for the above data.

Does the regression match the one achieved in Excel?
___________________________________________________________________
___________________________________________________________________
How can you extract the Linear Equation from the SPSS result of the regression?
___________________________________________________________________
___________________________________________________________________
___________________________________________________________________
- Predict the number of bushels of wheat that would be produced for a rainfall amount of 6.2 inches. Write the answer below.
Number of bushels produced after 6.2 inches of rain: _________________________________