Introduction to SPSS
SPSS is a statistical analysis program that allows:
- Data management in a spreadsheet-like format
- The ability to create graphs and tables
- A broad range of statistical analyses
Goals for this section of the course include:
- Becoming familiar with Statistical Packages and what they can do
- Creating new Datasets
- Importing & exporting Datasets
- Manipulating data in a Dataset
- Basic analysis of data (mainly descriptive statistics)
- Producing professional quality output using Word, Equation Editor, PowerPoint and SPSS results.
- An overview of SPSS's advanced features
Note: This is not a statistics course such as Math 207. We will only concentrate on basic statistical concepts.
Examining the Help utility within SPSS
Open up SPSS.
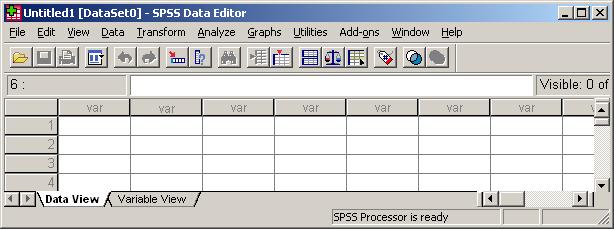
SPSS has a very nice help utility as part of the application. Let's briefly examine this utility before diving into SPSS.
Creating a Simple Dataset
5.1 Problem
- Create the variables needed for the following dataset. They will all be numeric for starters. Where can the variables be found for this dataset?
Note: Variable names must begin with a letter and cannot contain
spaces or any illegal characters. Let's use the following convention
for variable namnes: 1) the name begins with a letter and 2) the
variable can contain letters, numbers, an underscore, or a period.
| Brand |
Name |
ServingPerPkg |
OzPerPkg |
Calories |
TotalFatInGrams |
SatFatInGrams |
| M&M/Mars |
Snickers Peanut Butter |
1.0 |
2.00 |
310 |
20.0 |
7.0 |
| Hershey |
Cookies 'n Mint |
1.0 |
1.55 |
230 |
12.0 |
6.0 |
| Hershey |
Cadbury Dairy Milk |
3.5 |
5.00 |
220 |
12.0 |
8.0 |
|
|
3.0 |
3.70 |
170 |
8.0 |
3.0 |
| Charms |
Sugar Daddy |
1.0 |
1.70 |
200 |
2.5 |
2.5 |
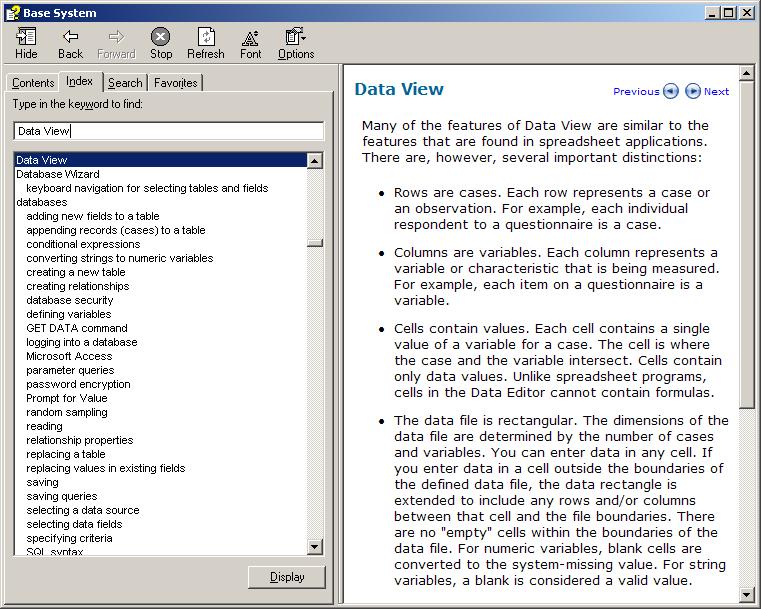
- Switch to Data View and look at your variables.
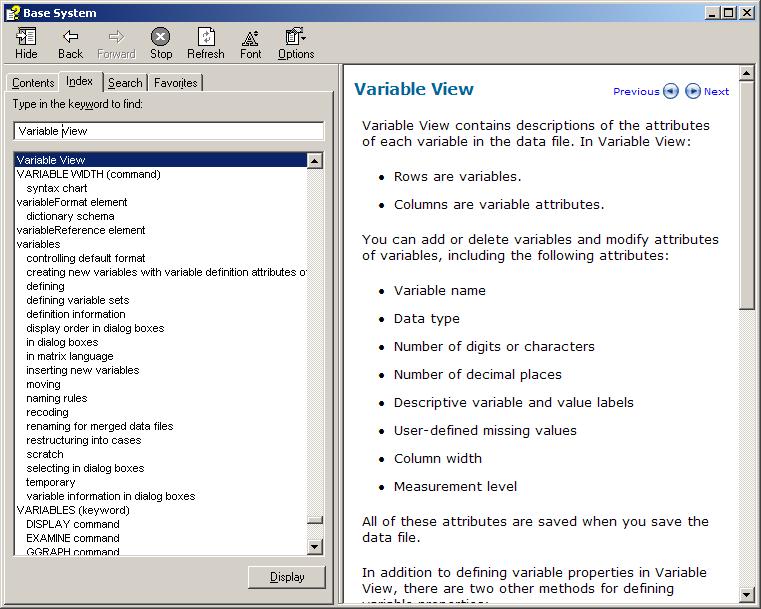
- Going back to Variable View, change the type of Name to a String and the decimals column is to be 0, 0, 1, 2, 0, 1, 1.
- In the Values column, create the Value Labels for Brand where 1 = "M&M/Mars", 2 = "Hershey", 3 = "Charms"
- Enter the data into the correct SPSS cells in the Data View. As you are entering the data into the cells, you will notice that some of the data cannot be entered correctly. You will need to switch to the Variable View to fix these problems.
- Create descriptive statistics that specify: Mean _______, Standard Deviation __________, Minimum _________, Maximum __________ for Total Fat.
Using the SPSS Tutorial, SPSS Help, or Web define each of the following terms and give a real life example of each.
SPSS contains the following data types (measures):
- Categorical:
____________________________________________________________
____________________________________________________________
____________________________________________________________
- Nominal:
______________________________________________________
______________________________________________________
______________________________________________________
- Ordinal
______________________________________________________
______________________________________________________
______________________________________________________
- Scale:
____________________________________________________________
____________________________________________________________
____________________________________________________________
For the data in Problem 1, what is the type and measure for the data for each of the variables? Why?
- Brand: ______________________________________________________
- Name: ______________________________________________________
- ServingPerPkg: _______________________________________________
- OzPerPkg: __________________________________________________
- Calories: ____________________________________________________
- TotalFatInGrams: _____________________________________________
- SatFatInGrams: ______________________________________________
Types of Data Analysis
When doing data analysis, we are interested in two types of summaries:
- Statistical Summaries (e.g. descriptive, hypothesis testing)
- Visual Summaries (e.g. tables, graphs)
Statistics is sometimes broken up into two different areas:
- Descriptive Statistics
- a situation is described by the statistics by the collection,
summarization, organization and presentation of data.
- Inferential
Statistics - where inferences are made from samples of the population
(e.g. smokers smoking a pack of cigarettes per day have a higher
cholesterol). In this area we get into Hypothesis testing.
In the Descriptive Statistics world, we are
concerned about each of the following.
Give a general description and example of each of the following terms:
Mean ________________________________________________________________
Median __________________________________________________
Mode____________________________________________________
5.2 Problem
A paint manufacturer tested two
experimental brands of paint over a period of months to determine how
long they would last without fading. Here are the results:
| Brand A |
Brand B |
| 10 |
25 |
| 20 |
35 |
| 60 |
40 |
| 40 |
45 |
| 50 |
35 |
| 30 |
30 |
- Method #1: One way has two variable columns where the
first is BrandA and the second is BrandB. Enter the above data and find
the asked for information. Save this file as BrandMethod1.sav.
- Find the mean __________, median __________, mode __________, std deviation __________, minimum __________, maximum __________ using SPSS.
- What do the descriptive statistics tell us about the paint with regard to fading?
- What are the type and measure values for Brand A _________________ and Brand B _________________?
- Method #2: The second way has two columns where the
first column is a variable called Brand and the second column is called
Fading. Create value labels where 1="BrandA" and 2="BrandB". Enter the
information and find the asked for information. Save this file as
BrandMethod2.sav.
- Find the mean __________, median __________, mode __________, std deviation __________, minimum __________, maximum __________ using SPSS.
- What do the descriptive statistics tell us about the paint with regard to fading?
- What are the type and measure values for Brand _________________ and Fading _________________?
5.3 Problem
- To
make sure we stay fresh with Excel for the final, here's a little
problem. Generate 100 random integer numbers (i.e. the numbers do not
contain any decimal places) between 1 and 20. Beside each number output
"EVEN" or "ODD". Save this file as random.xls.
- Import this data into SPSS and create a Histogram and Pie Chart of the dataset.